
Among the 10 languages compared, Japanese is the one people search a translator for most in 27 states, ahead of Chinese (16 places), French (5) and Portuguese (2). Spanish was analyzed separately because its search volume would flatten the trends for the other languages. In none of the 27 Japanese-led states is Japanese the main language spoken at home after English and Spanish, and across the 42 places where searches and speakers can be compared, the most-searched language matches the top spoken language in only 14.
Key Highlights:
Japanese and Chinese dominate translator searches. Among the 10 languages compared, Japanese is the most searched in 27 states, Chinese in 16 places (15 states and DC), French in 5 and Portuguese in 2. Alaska cannot be measured.
-
Japanese or Chinese is first or second in all 50 places measured. French and Portuguese lead only in the Northeast, Louisiana and Wyoming.
Japanese is not the top spoken language after English and Spanish in any state. In none of the 27 Japanese-led states is Japanese the largest named language spoken at home after English and Spanish.
Searches and speakers match in only 14 of 42 comparable places. Chinese matches in 8 (CA, DE, MD, NJ, NY, PA, UT, WA), French in 4 (LA, ME, NH, VT) and Portuguese in 2 (MA, RI). A further 8 places cannot be compared and Alaska is excluded.
Spanish is the largest non-English language at home in 48 of 51 places. It is spoken by 42.9 million people, 13.6% of residents aged 5 and over and 60.9% of all non-English speakers. Maine, Alaska and Hawaii are the exceptions.
Of the 50 measured leaders, 43 hold even after allowing for Google's rounding, and 16 are close calls where the top two languages are within 10% of each other. "Searched" always means searches for "[language] translator", not interest in a language itself.
43 of the 50 Measured Results Are Japanese or Chinese
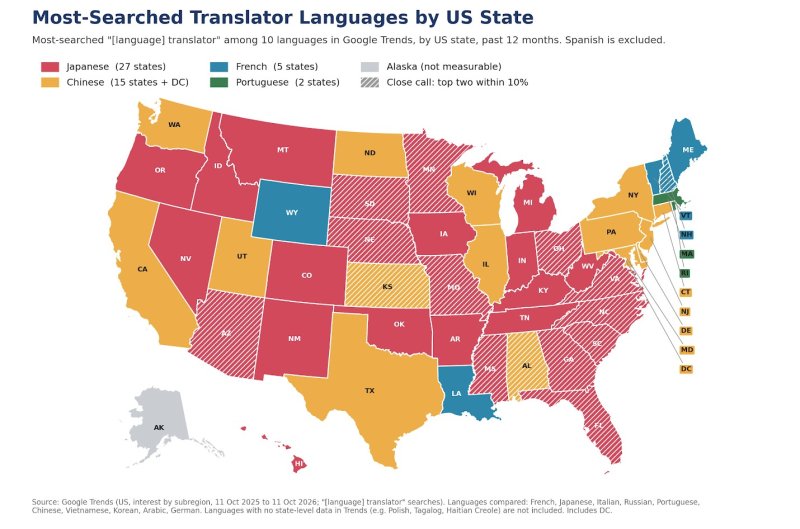
Hatched states are close calls, where the top two languages are within 10% of each other.
The Northeast Is the Only Region Where Japanese Never Leads
Japanese leads in the South, Midwest and West, while the Northeast is the only region where French and Portuguese lead more than once. Regions are the four Census Bureau regions, and DC counts in the South.
| Region | Places | Japanese | Chinese | French | Portuguese | Not measurable |
|---|---|---|---|---|---|---|
| Northeast | 9 | 0 | 4 | 3 | 2 | 0 |
| Midwest | 12 | 8 | 4 | 0 | 0 | 0 |
| South | 17 | 11 | 5 | 1 | 0 | 0 |
| West | 13 | 8 | 3 | 1 | 0 | 1 |
| United States | 51 | 27 | 16 | 5 | 2 | 1 |
The largest leads are French in Vermont (2.12 times the runner-up), Japanese in Hawaii (2.05), Chinese in New York (2.00), Chinese in California (1.82), French in Maine (1.69) and Japanese in Oregon (1.60). The median lead is 1.12 times for Japanese-led places and 1.26 times for Chinese-led places, so many Japanese leads are narrow (12 of the 27 are close calls). The 16 close calls are DC, New Hampshire, Ohio, Virginia, Mississippi, Georgia, Kansas, South Carolina, Alabama, Nebraska, Missouri, North Carolina, Minnesota, South Dakota, Florida and Arizona.
Searches Match the Top Spoken Language in Only 14 of 42 Places
The most-searched translator language is not the top spoken language in 28 of the 42 places where both can be compared. The comparison uses the largest single named language spoken at home after English and Spanish, so catch-all groups such as "other Native languages of North America" are not counted.
| Result | Places | Detail |
|---|---|---|
| Match | 14 | Chinese: CA, DE, MD, NJ, NY, PA, UT, WA. French: LA, ME, NH, VT. Portuguese: MA, RI |
| Mismatch | 28 | The most-searched language differs from the top spoken language |
| Not comparable | 8 | Top spoken language has no state data in Google Trends (Hmong: MN, WI. Tagalog: HI, NV. Polish: IL. Haitian Creole: FL) or cannot be put on the same scale (Navajo: AZ, NM, see Methodology) |
| Not measurable | 1 | Alaska |
German is the top spoken language in 9 of the mismatch places: Idaho, Indiana, Iowa, Kentucky, Montana, South Carolina and South Dakota search Japanese most, North Dakota searches Chinese, and Wyoming searches French. Vietnamese is the top spoken language in 6 (Arkansas, Kansas, Mississippi, Nebraska, Oklahoma, Texas), and Kansas and Texas search Chinese most while the other four search Japanese.
Arabic is the top spoken language in 5 (Michigan, Ohio, Tennessee, Virginia, West Virginia) and Chinese in 5 (Colorado, Georgia, Missouri, North Carolina, Oregon), and all 10 of those search Japanese most. The other three are DC (French spoken, Chinese searched), Alabama (Korean spoken, Chinese searched) and Connecticut (Portuguese spoken, Chinese searched).
Only 12 of the 28 mismatches are firm. In the other 16 the search leader is a close call or cannot be separated from the runner-up after rounding, or the top two spoken languages are statistically tied.
Spanish Searches Track Speakers Closely, but Nebraska Ranks 2nd on Searches and 21st on Speakers
Spanish-translator search interest tracks Spanish speaker share closely across the 51 places (correlation 0.75), but a handful of states rank much higher for searches than for speakers. Google Trends returned no state data when Spanish was compared with French, so Spanish uses its own single-term index where the top state scores 100. The index is relative, not a count of searches.
New Mexico, Texas and Florida sit in the top five for both measures, and six places (New Mexico, Texas, Florida, California, Arizona and Nevada) are in the top 10 for both. California, Texas and Florida alone hold 23.2 million of the 42.9 million Spanish speakers, or 54%.
| State | Interest index (0 to 100) | Interest rank | Spanish speakers, % of residents aged 5+ | Speaker-share rank |
|---|---|---|---|---|
| Nebraska | 98 | 2 | 8.43% | 21 |
| South Carolina | 70 | 11 | 5.25% | 30 |
| Indiana | 65 | 14 | 5.48% | 29 |
| Kentucky | 63 | 16 (tied) | 3.44% | 38 |
| Louisiana | 62 | 18 (tied) | 4.66% | 34 |
| New York | 60 | 27 (tied) | 14.77% | 8 |
| Rhode Island | 59 | 30 (tied) | 13.51% | 10 |
| Massachusetts | 46 | 42 (tied) | 9.65% | 14 |
The first five rows rank far higher for interest than for speaker share, and the last three show the reverse. Interest rank is out of 51 places, and a gap in rank does not show why people in a state search as they do.
The Spanish figures are also the most settled in the report: Spanish is the largest non-English language at home in 48 of 51 places, and in the median place Spanish speakers outnumber the next-largest language category about 9.5 to 1. Maine (French), Alaska (other Native languages of North America) and Hawaii (Ilocano, Samoan, Hawaiian and other Austronesian languages) are the three exceptions.
Spanish is spoken by 28.3% of residents in California, 28.1% in Texas, 24.5% in New Mexico, 22.6% in Florida and 19.9% in Nevada, against 1.0% in Maine, 1.2% in West Virginia, 1.3% in Vermont and 1.4% in Montana.
State by State: See How Yours Compares
Every state's result is below, so local coverage can cite its own state. Lead is the most-searched language's ratio over the runner-up's, and "close" marks a lead of 1.10 times or less. Spanish interest is the 0 to 100 index described in the Spanish section.
Largest leads by language
| Language | Largest leads (times the runner-up) |
|---|---|
| Japanese | Hawaii 2.05x, Oregon 1.60x, Montana 1.55x, New Mexico 1.37x |
| Chinese | New York 2.00x, California 1.82x, New Jersey 1.58x, Maryland 1.30x |
| French | Vermont 2.12x, Maine 1.69x, Wyoming 1.27x, Louisiana 1.19x |
| Portuguese | Rhode Island 1.56x, Massachusetts 1.51x |
All 50 states and DC
| State | Most Googled | Runner-up | Lead | Top spoken at home | Googled = spoken? | Spanish speakers, % of residents | Spanish-translator |
|---|---|---|---|---|---|---|---|
| Alabama | Chinese | Japanese | 1.09x (close) | Korean | No | 3.90% | 60 |
| Alaska | No result | Tagalog | n/a | 3.30% | 47 | ||
| Arizona | Japanese | Chinese | 1.09x (close) | Navajo | Not comparable | 19.30% | 81 |
| Arkansas | Japanese | Chinese | 1.16x | Vietnamese | No | 6.10% | 61 |
| California | Chinese | Japanese | 1.82x | Chinese | Yes | 28.30% | 82 |
| Colorado | Japanese | Chinese | 1.19x | Chinese | No | 11.10% | 64 |
| Connecticut | Chinese | Japanese | 1.28x | Portuguese | No | 12.80% | 61 |
| Delaware | Chinese | Japanese | 1.26x | Chinese | Yes | 7.90% | 67 |
| District of Columbia | Chinese | French | 1.10x (close) | French | No | 9.40% | 54 |
| Florida | Japanese | Chinese | 1.03x (close) | Haitian | Not comparable | 22.60% | 91 |
| Georgia | Japanese | Chinese | 1.07x (close) | Chinese | No | 8.60% | 78 |
| Hawaii | Japanese | Chinese | 2.05x | Tagalog | Not comparable | 2.00% | 35 |
| Idaho | Japanese | Chinese | 1.23x | German | No | 8.10% | 63 |
| Illinois | Chinese | Japanese | 1.29x | Polish | Not comparable | 14.00% | 61 |
| Indiana | Japanese | Chinese | 1.12x | German | No | 5.50% | 65 |
| Iowa | Japanese | Chinese | 1.22x | German | No | 4.70% | 61 |
| Kansas | Chinese | Japanese | 1.06x (close) | Vietnamese | No | 8.10% | 51 |
| Kentucky | Japanese | Chinese | 1.17x | German | No | 3.40% | 63 |
| Louisiana | French | Chinese | 1.19x | French | Yes | 4.70% | 62 |
| Maine | French | Japanese | 1.69x | French | Yes | 1.00% | 34 |
| Maryland | Chinese | Japanese | 1.30x | Chinese | Yes | 9.60% | 62 |
| Massachusetts | Portuguese | Chinese | 1.51x | Portuguese | Yes | 9.70% | 46 |
| Michigan | Japanese | Chinese | 1.17x | Arabic | No | 3.10% | 41 |
| Minnesota | Japanese | Chinese | 1.04x (close) | Hmong | Not comparable | 4.20% | 49 |
| Mississippi | Japanese | Chinese | 1.09x (close) | Vietnamese | No | 2.70% | 54 |
| Missouri | Japanese | Chinese | 1.03x (close) | Chinese | No | 2.90% | 53 |
| Montana | Japanese | Chinese | 1.55x | German | No | 1.40% | 50 |
| Nebraska | Japanese | Chinese | 1.09x (close) | Vietnamese | No | 8.40% | 98 |
| Nevada | Japanese | Chinese | 1.28x | Tagalog | Not comparable | 19.90% | 89 |
| New Hampshire | French | Japanese | 1.09x (close) | French | Yes | 2.60% | 42 |
| New Jersey | Chinese | Portuguese | 1.58x | Chinese | Yes | 17.20% | 62 |
| New Mexico | Japanese | Chinese | 1.37x | Navajo | Not comparable | 24.50% | 100 |
| New York | Chinese | Japanese | 2.00x | Chinese | Yes | 14.80% | 60 |
| North Carolina | Japanese | Chinese | 1.06x (close) | Chinese | No | 8.70% | 74 |
| North Dakota | Chinese | Japanese | 1.22x | German | No | 2.30% | 39 |
| Ohio | Japanese | Chinese | 1.06x (close) | Arabic | No | 2.60% | 45 |
| Oklahoma | Japanese | Chinese | 1.11x | Vietnamese | No | 8.10% | 69 |
| Oregon | Japanese | Chinese | 1.60x | Chinese | No | 9.00% | 62 |
| Pennsylvania | Chinese | Japanese | 1.25x | Chinese | Yes | 5.60% | 56 |
| Rhode Island | Portuguese | Chinese | 1.56x | Portuguese | Yes | 13.50% | 59 |
| South Carolina | Japanese | Chinese | 1.02x (close) | German | No | 5.30% | 70 |
| South Dakota | Japanese | Russian | 1.03x (close) | German | No | 2.60% | 58 |
| Tennessee | Japanese | Chinese | 1.21x | Arabic | No | 5.20% | 59 |
| Texas | Chinese | Japanese | 1.26x | Vietnamese | No | 28.10% | 97 |
| Utah | Chinese | Japanese | 1.29x | Chinese | Yes | 10.90% | 92 |
| Vermont | French | Japanese | 2.12x | French | Yes | 1.30% | 38 |
| Virginia | Japanese | Chinese | 1.08x (close) | Arabic | No | 7.90% | 60 |
| Washington | Chinese | Japanese | 1.25x | Chinese | Yes | 9.00% | 54 |
| West Virginia | Japanese | Chinese | 1.26x | Arabic | No | 1.20% | 45 |
| Wisconsin | Chinese | Japanese | 1.12x | Hmong | Not comparable | 4.90% | 61 |
| Wyoming | French | Chinese | 1.27x | German | No | 4.80% | 46 |
Methodology
What was searched. Google Trends "Interest by subregion" for the United States, covering 11 October 2025 to 11 October 2026, exported on 11 October 2026, using all categories and web search. The terms were "[language] translator" for 10 languages: French, Japanese, Italian, Russian, Portuguese, Chinese, Vietnamese, Korean, Arabic and German. This measures searches containing the word translator, not interest in a language itself.
How the languages were compared. Google Trends shows each term's share of searches among the terms compared in one chart, as whole numbers that sum to 100 in each state. Comparing Spanish with French returned no state data, so Spanish was not combined with the others. The 10 languages were pulled in three comparisons (French with Japanese, Italian, Russian and Portuguese; French with Chinese, Vietnamese, Korean and Arabic; French with German), each including "french translator". Every language's share was divided by French's share in the same state and comparison, which puts all 10 on one scale where French equals 1.0. The most-searched language is the one with the highest ratio, and the lead is its ratio divided by the runner-up's.
How firm each result is. Because Trends shares are rounded to whole numbers, each was treated as accurate to plus or minus 0.5. A leader is firm to rounding if its lowest possible ratio is above every other language's highest possible ratio. 43 of the 50 measured leaders pass. The 7 that do not are Florida, Kansas, Minnesota, Missouri, North Carolina, South Carolina and South Dakota. A close call is a lead of 1.10 times or less, which applies to 16 places. A language whose share rounds to 0 in a state cannot be measured there and cannot lead. German rounds to 0 in DC, Delaware, Hawaii, North Dakota, Rhode Island, South Dakota and Vermont.
Alaska. French needs a share above 3 to serve as the baseline. Alaska's French share is 0, so Alaska has no result.
What could not be measured. Google Trends returned no state data for "polish translator", "tagalog translator", "haitian creole translator", "hmong translator", "hindi translator", "ukrainian translator", "greek translator", "persian translator" and "hebrew translation". "navajo translator" returned state data for only 9 states, as a single-term index with New Mexico at 100 and Arizona at 36, which cannot be put on the same scale as the 10 languages, so Arizona and New Mexico stay not comparable. The alternative phrasings "[language] translation" and "[language] to English" also returned no state data, so the Japanese and Chinese leads could not be checked against other wording. A zero or missing value means Google does not publish it, not that no one searched.
What was spoken. Language spoken at home by residents aged 5 and over, from American Community Survey table B16001, 5-year estimates for 2020 to 2024, for the 50 states and DC (Puerto Rico excluded). National totals are the sum of the 51 state estimates, so they can differ slightly from the Census Bureau's own national table. "Top spoken language" is the largest single named language other than English and Spanish. Catch-all groups, such as "other Native languages of North America" or "other Indo-European languages", are not used to decide a match. A top-two spoken tie means the gap between the two languages is smaller than their combined margins of error, and it applies to 8 of the 28 mismatches.
Match, mismatch and not comparable. A place is a match if its most-searched language equals its top spoken language, a mismatch if they differ, and not comparable if the top spoken language is not one of the 10 measured. A mismatch is firm only if the search leader is firm to rounding and not a close call, and the top two spoken languages are not tied. 12 of the 28 mismatches meet that test.
Spanish layer. The "spanish translator" index comes from a separate single-term Trends export in which the top state scores 100. It is relative interest and cannot be compared with the French-relative values. Ranks are out of 51 places and shared where states have the same index. The correlation of 0.75 is a Pearson correlation between the index and Spanish speakers as a share of residents aged 5 and over.
Verification. Every figure in this report was recomputed from the raw Trends and Census files, independently of the earlier working tables, and matched the final data table for all 50 measured places. Trends data is sampled and rounded by Google, so the figures are as accurate as Google publishes them, and repeating the export on another day may shift small values.
Data sources
| Data | Source | Detail |
|---|---|---|
| Search interest by state | Google Trends | Interest by subregion, United States, 11 Oct 2025 to 11 Oct 2026, three multi-term exports and one single-term export for "spanish translator" downloaded on 11 Oct 2026, plus a single-term export for "navajo translator" downloaded on 12 Oct 2026 (12 Oct 2025 to 12 Oct 2026); all categories, web search |
| Languages spoken at home | US Census Bureau, American Community Survey | Table B16001, Language Spoken at Home by Ability to Speak English for the Population 5 Years and Over, 2024 ACS 5-year estimates (2020 to 2024), all states and DC |
| Margins of error | Same Census table | 90% margins of error as published, used for the spoken-language ties |
| Final Dataset | Googled_vs_Spoken_Final_Data_Table |