
The UK Migration Story Has Flipped
Official data shows British and EU+ nationals are now net-leaving the UK. We analysed public migration, visa and student-route data to identify where UK-linked movers are appearing next.
Key Findings
British and EU+ nationals are now a combined net loss of 178,000 people from the UK, based on British net migration of -136,000 and EU+ net migration of -42,000.
246,000 British nationals left the UK in the year ending December 2025, compared with 110,000 British nationals arriving.
EU+ net migration has been negative since the year ending June 2022, showing the European outflow is not a one-off anomaly.
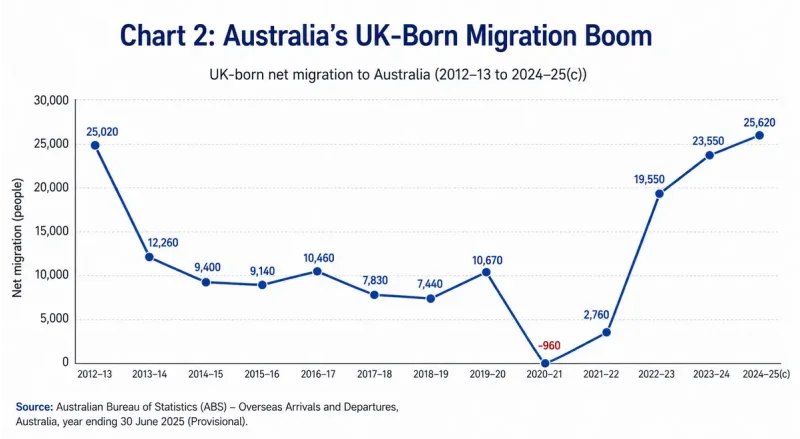
Australia shows the clearest destination-side signal, with UK-born net overseas migration reaching 25,620 in 2024–25.
UK-born arrivals to Australia outnumbered UK-born departures by nearly 3 to 1, with 40,180 arrivals versus 14,550 departures in 2024–25.
Western Australia had the strongest UK-born state-level gain in Australia, with the UK contributing the largest country-of-birth net migration gain to the state.
Canada shows strong UK youth-mobility demand, with the UK Working Holiday route showing more invitations issued than its listed quota, because not every invitation converts into a visa place.
The U.S. signal is more exchange-led than student-led, with J exchange visitor visas outnumbering F academic student visas for nationals of Great Britain and Northern Ireland in FY2024.
Ireland is a modest net gainer of UK citizens, with 4,900 UK-citizen immigrants and 2,700 UK-citizen emigrants in the year to April 2025.
New Zealand shows almost no net UK-citizen gain, with 4,782 UK-citizen arrivals and 4,589 UK-citizen departures in 2025, a net gain of 193.
The UK migration story is usually told as a story of people arriving. The latest official data tells a different story: British and EU+ nationals are now leaving the UK faster than they are arriving.
In the year ending December 2025, British net migration was -136,000 and EU+ net migration was -42,000, creating a combined net outflow of 178,000 people. (ONS: Long-term international migration, provisional: year ending December 2025)
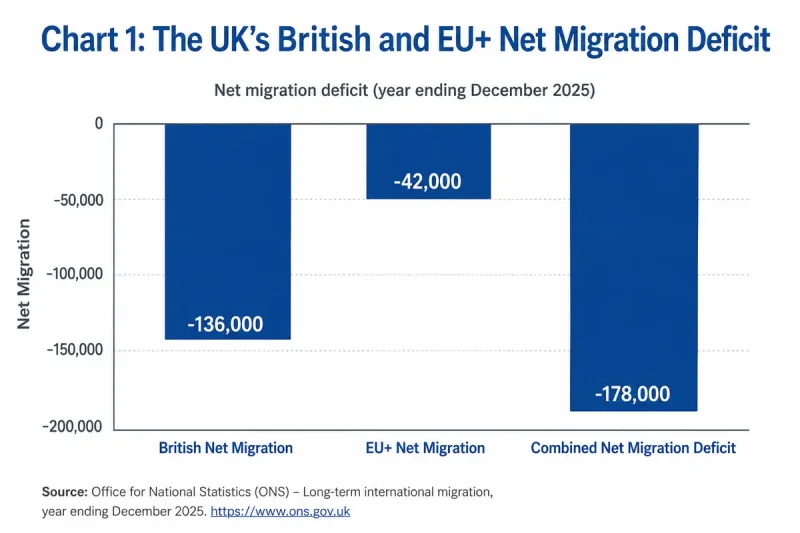
British net migration was -136,000. EU+ net migration was -42,000. Together, this means the UK recorded a combined British and EU+ net migration balance of -178,000.
This creates a new question for the UK migration debate:
If British and EU+ nationals are leaving the UK faster than they are arriving, where are they showing up next?
The Destination Map Is Not Straightforward
UK does not publish a complete destination map for British nationals leaving the country. ONS can estimate how many British nationals leave the UK, but it does not produce estimates showing exactly where British nationals abroad live. For that reason, this analysis compares UK outflow data with destination-side migration, visa, student and work-route data from Australia, Canada, Ireland, New Zealand and the United States.
| Destination | Strongest available signal | Latest finding | Interpretation |
|---|---|---|---|
| Australia | UK-born overseas migration | +25,620 net UK-born migration | Strongest destination-side signal |
| Canada | UK Working Holiday invitations | Invitations above listed quota | Strong UK youth-mobility demand |
| United States | Visa issuances by category | J visas exceed F student visas | Exchange-led, not student-led |
| Ireland | UK-citizen migration | +2,200 net UK-citizen migration | Modest UK-citizen gain |
| New Zealand | UK-citizen migration | +193 net UK-citizen migration | Almost flat |
Australia Emerges as the Clearest Winner From Britain’s Exit Wave
Australia produces the strongest destination-side signal.
Australian Bureau of Statistics data shows UK-born net overseas migration to Australia reached 25,620 in 2024–25. That compares with 7,440 in 2018–19, meaning the UK-born net gain is now more than three times its pre-pandemic level.
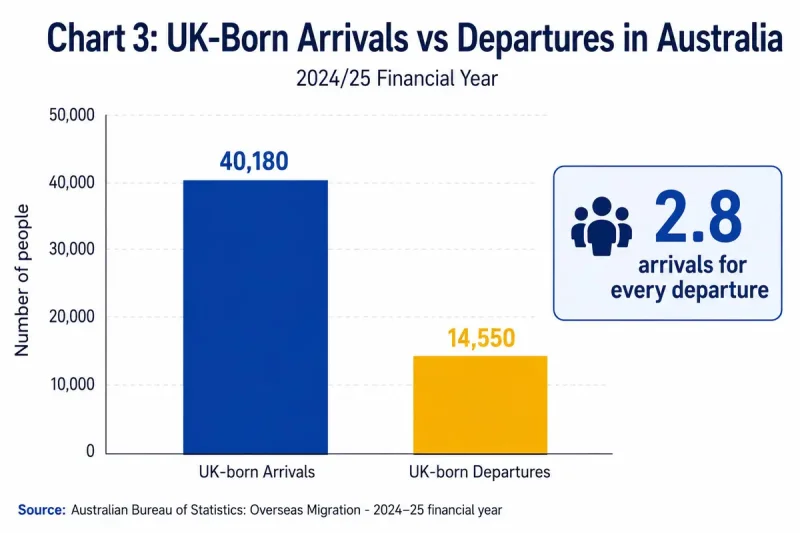
UK-born arrivals to Australia also significantly outnumber departures. In 2024–25, there were 40,180 UK-born migrant arrivals and 14,550 UK-born migrant departures, producing an arrivals-to-departures ratio of roughly 2.8 to 1. (Australian Bureau of Statistics: Overseas Migration - 2024-25 financial year)
Western Australia, Victoria, New South Wales and Queensland stand out in particular. ABS states that in 2024–25, the UK was the country of birth contributing the largest net overseas migration gain to Western Australia. The UK-born net migration gain for Western Australia was 6,470.
Australia also has a strong youth-mobility signal. ONS, citing Australian Home Affairs data, reports that in the year ending June 2025, more than 79,000 British citizens were granted Australian Working Holiday Maker visas, up from around 20,000 in the year ending June 2024. Around 20,000 skilled British workers were also granted temporary or permanent visas. (ONS: UK emigration explained: what we know about Brits moving abroad 21 May 2026)
This does not mean every Working Holiday Maker is a long-term migrant. Many are temporary movers, and some stays last less than 12 months. But as a signal of British youth mobility, Australia is the strongest destination in the available public data.
Canada Shows Youth-Mobility Demand, Not a Complete Migration Picture
Canada is another important destination, but the available public signal is different.
Canada’s International Experience Canada programme is a strong indicator of young British mobility. The official IRCC page listed the UK Working Holiday quota at 9,330, with 13,426 invitations issued to date and 553 spots available in the latest published round information. IRCC makes clear that invitations can exceed the quota because candidates may decline invitations, withdraw applications or be refused.
This is useful for understanding demand and route activity, but it is not the same as permanent migration. Working Holiday participation does not prove that a person has permanently relocated to Canada, and invitations are not the same as issued work permits.
The defensible conclusion is narrower and stronger: Canada is showing clear UK youth-mobility demand, but the available public data should not be used as a direct count of British people permanently moving from the UK to Canada.
The United States Signal Is More Exchange-Led Than Student-Led
The United States has a different profile again.
The U.S. State Department’s fiscal year 2024 visa data shows that nationals of Great Britain and Northern Ireland were issued 16,147 J exchange visitor visas, compared with 4,740 F academic student visas and 2,299 H temporary worker visas. That means J exchange visitor visas outnumbered F student visas by roughly 3.4 to 1. (US Department of State: FY2024AnnualReport/Table XVI.pdf)
This suggests that, for the UK-to-U.S. mobility story, exchange and temporary cultural or educational routes may be more visible in the visa data than traditional academic student visas.
However, this source has limits. U.S. visa issuance data is by nationality and visa category. It does not show where in the United States people settle, nor does it prove that applicants were resident in the UK immediately before applying.
The defensible conclusion: the U.S. is a visible destination for British mobility, but the public visa data points more clearly to exchange routes than to a broad permanent-migration wave.
Ireland Is a Modest Net Gainer of UK Citizens
Ireland’s data shows a net gain of UK citizens, but not at the scale seen in Australia’s UK-born migration figures.
The Central Statistics Office estimates that in the year to April 2025, Ireland recorded 4,900 UK-citizen immigrants and 2,700 UK-citizen emigrants, producing a net UK-citizen migration gain of 2,200. (cso.ie: Population and Migration Estimates, April 2025)
Ireland also recorded much larger flows from other groups, including 31,500 returning Irish citizens, 25,300 other EU citizens, and 63,600 citizens from countries outside Ireland, the UK and the EU.
The Ireland finding is valuable because it is not exaggerated. Ireland is receiving more UK citizens than it is losing, but the available data does not suggest a dramatic UK-citizen surge.
New Zealand Shows Almost No Net UK-Citizen Gain
New Zealand provides one of the most interesting “no surge” findings.
Stats NZ-based migration data published via Figure.NZ shows 4,782 UK-citizen migrant arrivals and 4,589 UK-citizen migrant departures in 2025. That creates a net UK-citizen gain of just 193. (figure.nz: Migrant arrivals and departures to New Zealand by citizens of the United Kingdom)
This is a useful counterweight to the Australia finding. It shows that British and UK-linked mobility is not rising evenly across all English-speaking destinations.
The defensible conclusion: New Zealand remains part of the UK mobility map, but the latest UK-citizen net migration signal is close to flat.
The Big Finding: The UK Exit Is Real, But the Destination Story Is Uneven
The data supports three clear conclusions.
First, the UK is now losing more British and EU+ nationals than it gains. The combined British and EU+ net migration balance was -178,000 in the year ending December 2025.
Second, Australia is the clearest destination-side signal, with UK-born net migration to Australia reaching 25,620 in 2024–25 and Working Holiday Maker grants to British citizens rising sharply.
Third, the rest of the map is more complicated. Canada shows youth-mobility demand. The U.S. shows a strong exchange-visitor signal. Ireland shows a modest UK-citizen net gain. New Zealand shows almost no net UK-citizen gain.
That complexity is the story. The UK exit is not a single wave heading to one destination. It is a fragmented mobility shift shaped by age, visas, work rights, education routes and post-Brexit settlement patterns.